Evaluating Llama 3.3 70B Inference on NVIDIA H100 and A100 GPUs
Large‑scale language models quickly expose the limits of yesterday’s hardware. To understand how much practical head‑room Hopper offers over Ampere in a production‑style setting, I profiled llama-3.3-70b-instruct on two 4‑GPU hosts—one populated with A100 80GB (PCIe), the other with H100 80GB (SXM5). Inference was served via NVIDIA NIM using the default TensorRT‑LLM profiles (TP = 4, PP = 1, bfloat16).
Workloads and measurement were driven by one of NVIDIA’s benchmarking tools, genai‑perf; the accompanying charts were produced directly from benchmark.py with no manual post‑processing. The GitHub repository for the benchmark code
and raw data can be found in this GitHub repo. genai-perf measures several useful metrics, such as Time-To-First-Token (TTFT), Inter-Token Latency, and Tokens/Second - all driven by synthetically generated prompts for various patterned workloads.
Test Methodology
| Dimension | Setting |
|---|---|
| Model | llama‑3.3‑70b‑instruct |
| Container | nvcr.io/nim/meta/llama-3.3-70b-instruct:1.8.2 |
| Precision | bf16 |
| Parallelism | Tensor parallelism = 4, Pipeline parallelism = 1 |
| Traffic model | Synthetic prompts via genai-perf• 200 → 200 tokens (translation / Q&A) • 1,000 → 200 tokens (summarization) |
| Concurrency sweep | 1, 2, 5, 10, 50, 100, 250, 500 users |
| Metrics captured | • Total Tokens / Second (TPS) • Median Time‑To‑First‑Token (TTFT) |
Throughput Results
200 → 200 tokens
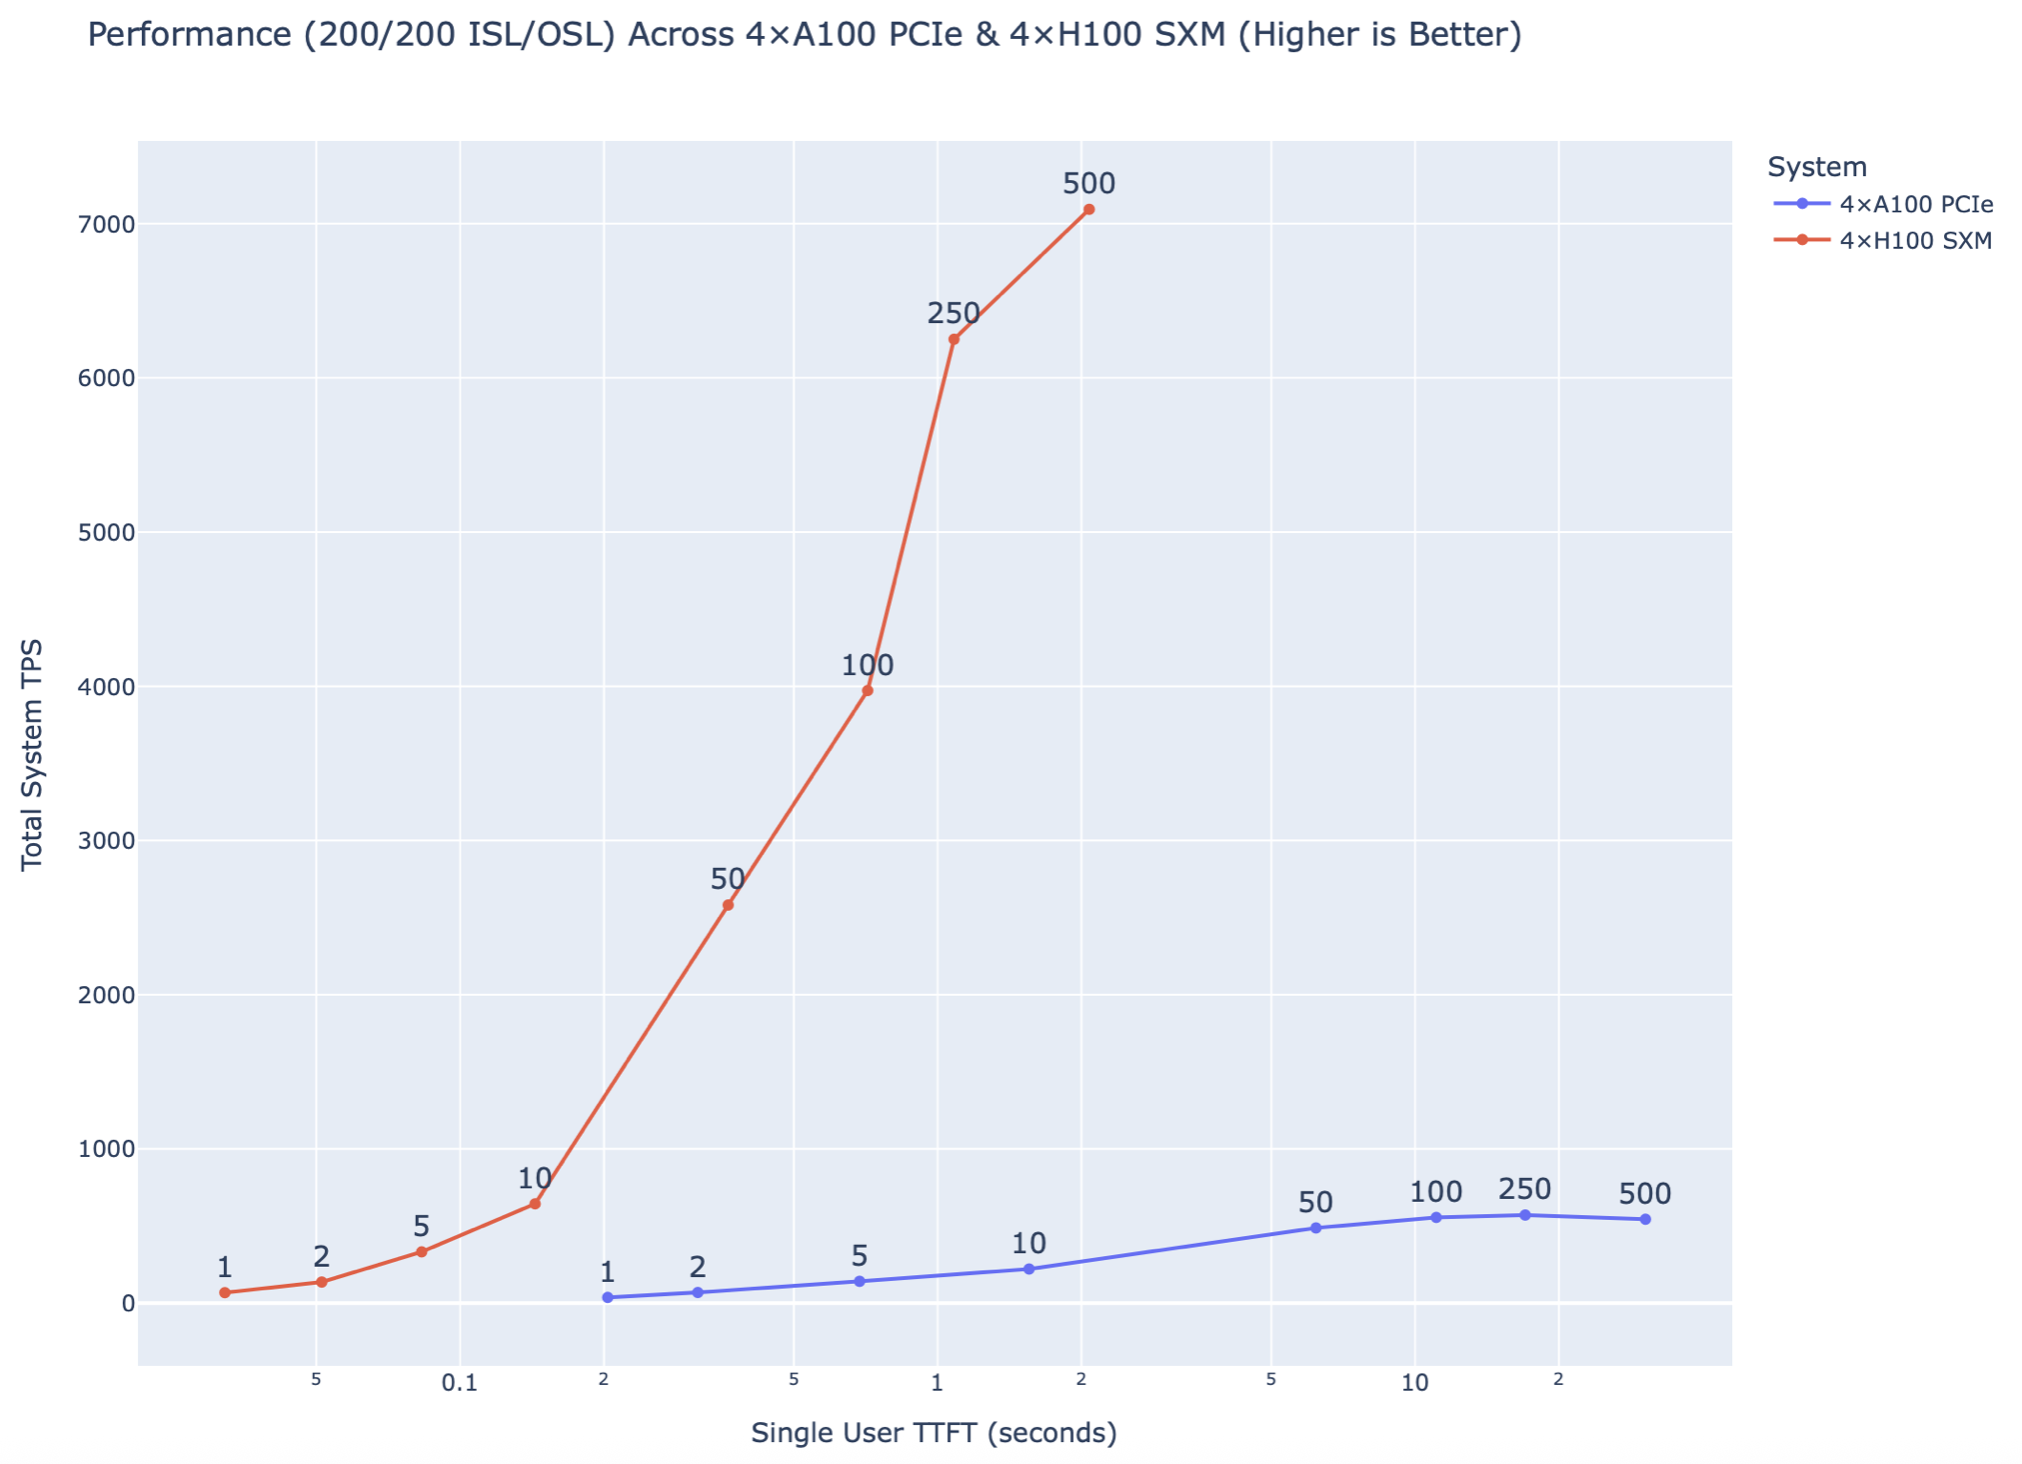
- H100 scaled almost linearly up to 500 users, peaking at ≈ 7,000 TPS.
- A100 saturated near ≈ 570 TPS and 50 users; additional users primarily increased queueing delay.
This corresponds to a ≈ 12–14× throughput advantage for the H100 configuration across the sweep.
1,000 → 200 tokens
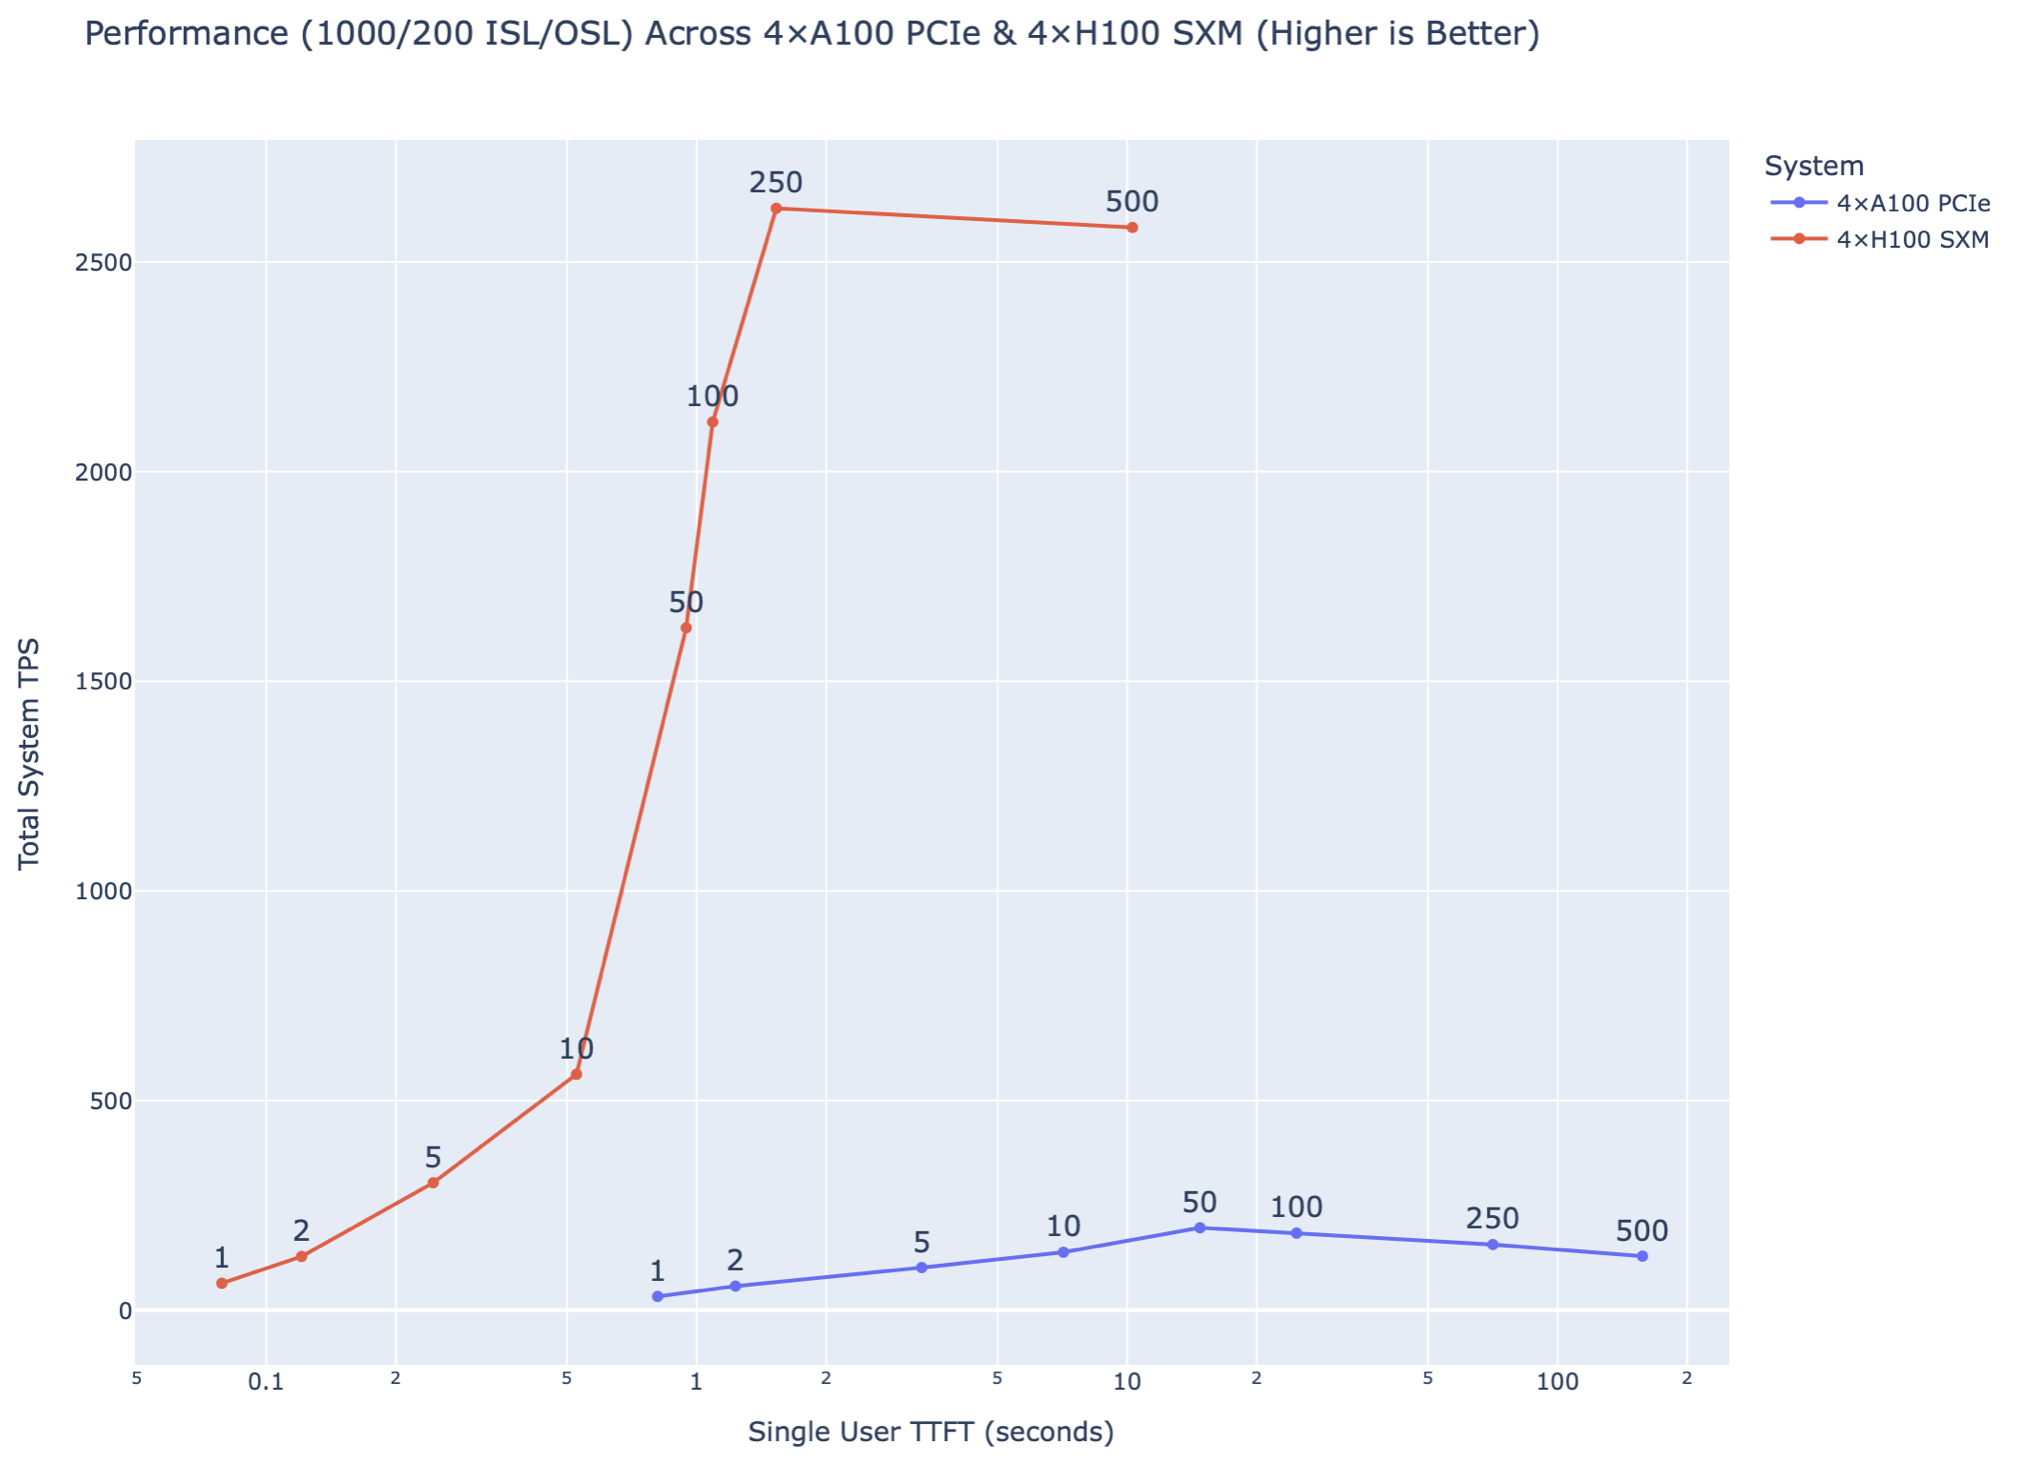
Longer inputs magnify memory pressure during decoding, yet the relative gap remains wide:
- H100 delivered ≈ 2,600 TPS at 250 concurrent users.
- A100 remained under ≈ 230 TPS at the same load.
Latency Under Load
200 → 200 tokens
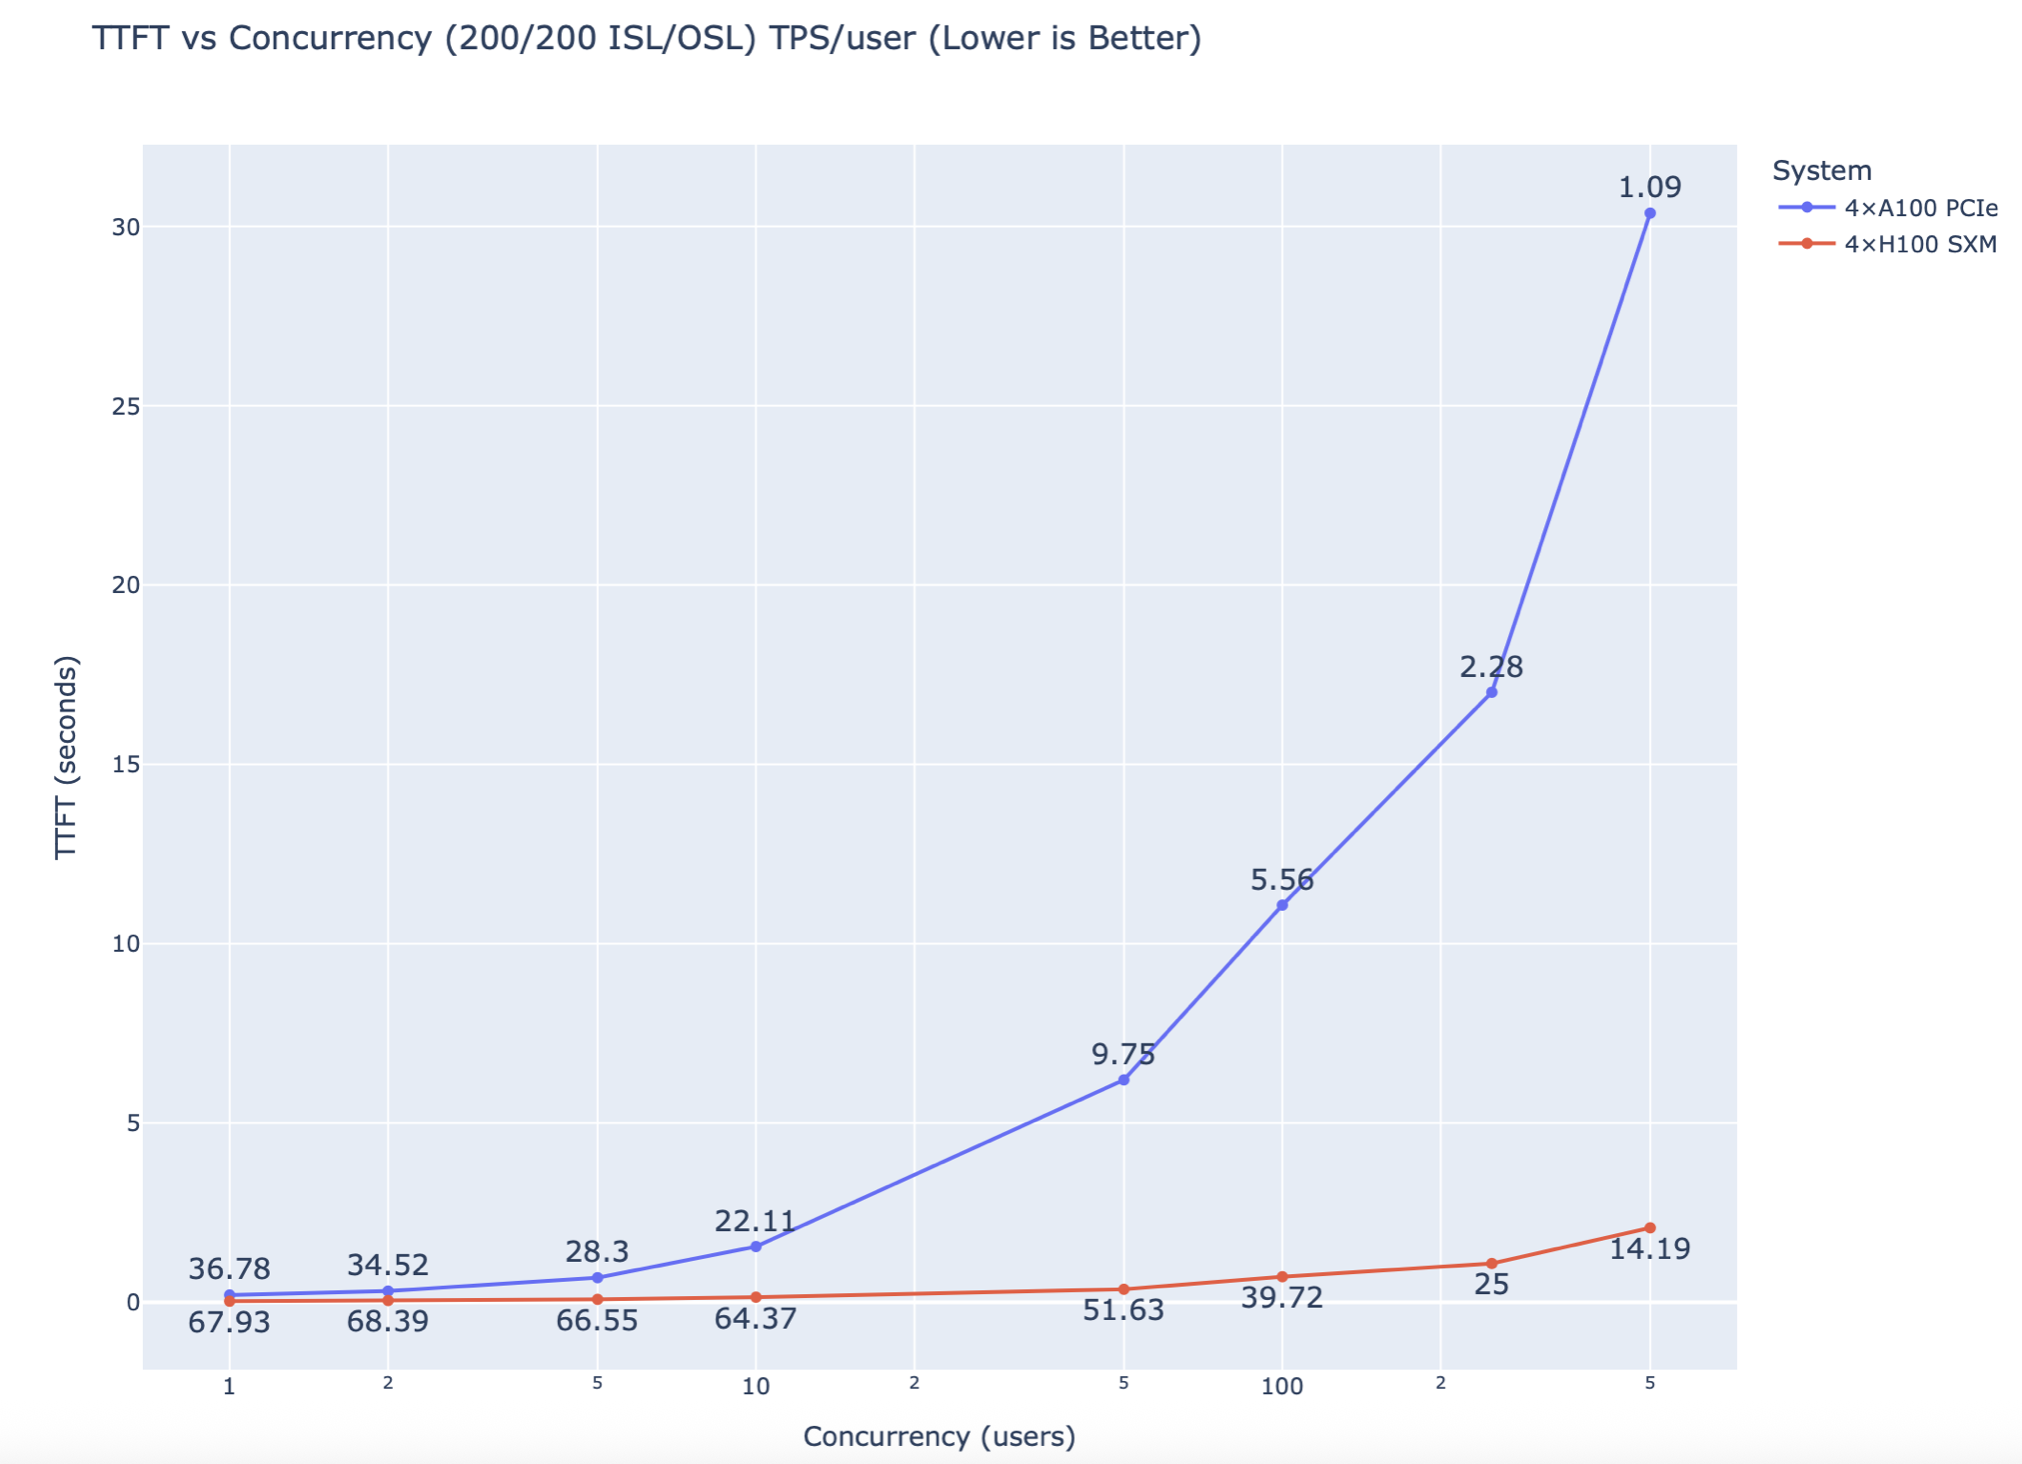
- H100 preserved a less than 5s TTFT up to 500 simultaneous sessions.
- A100 quickly surpasses >10s TTFT at 100 users and climbs quickly under high load.
1,000 → 200 tokens
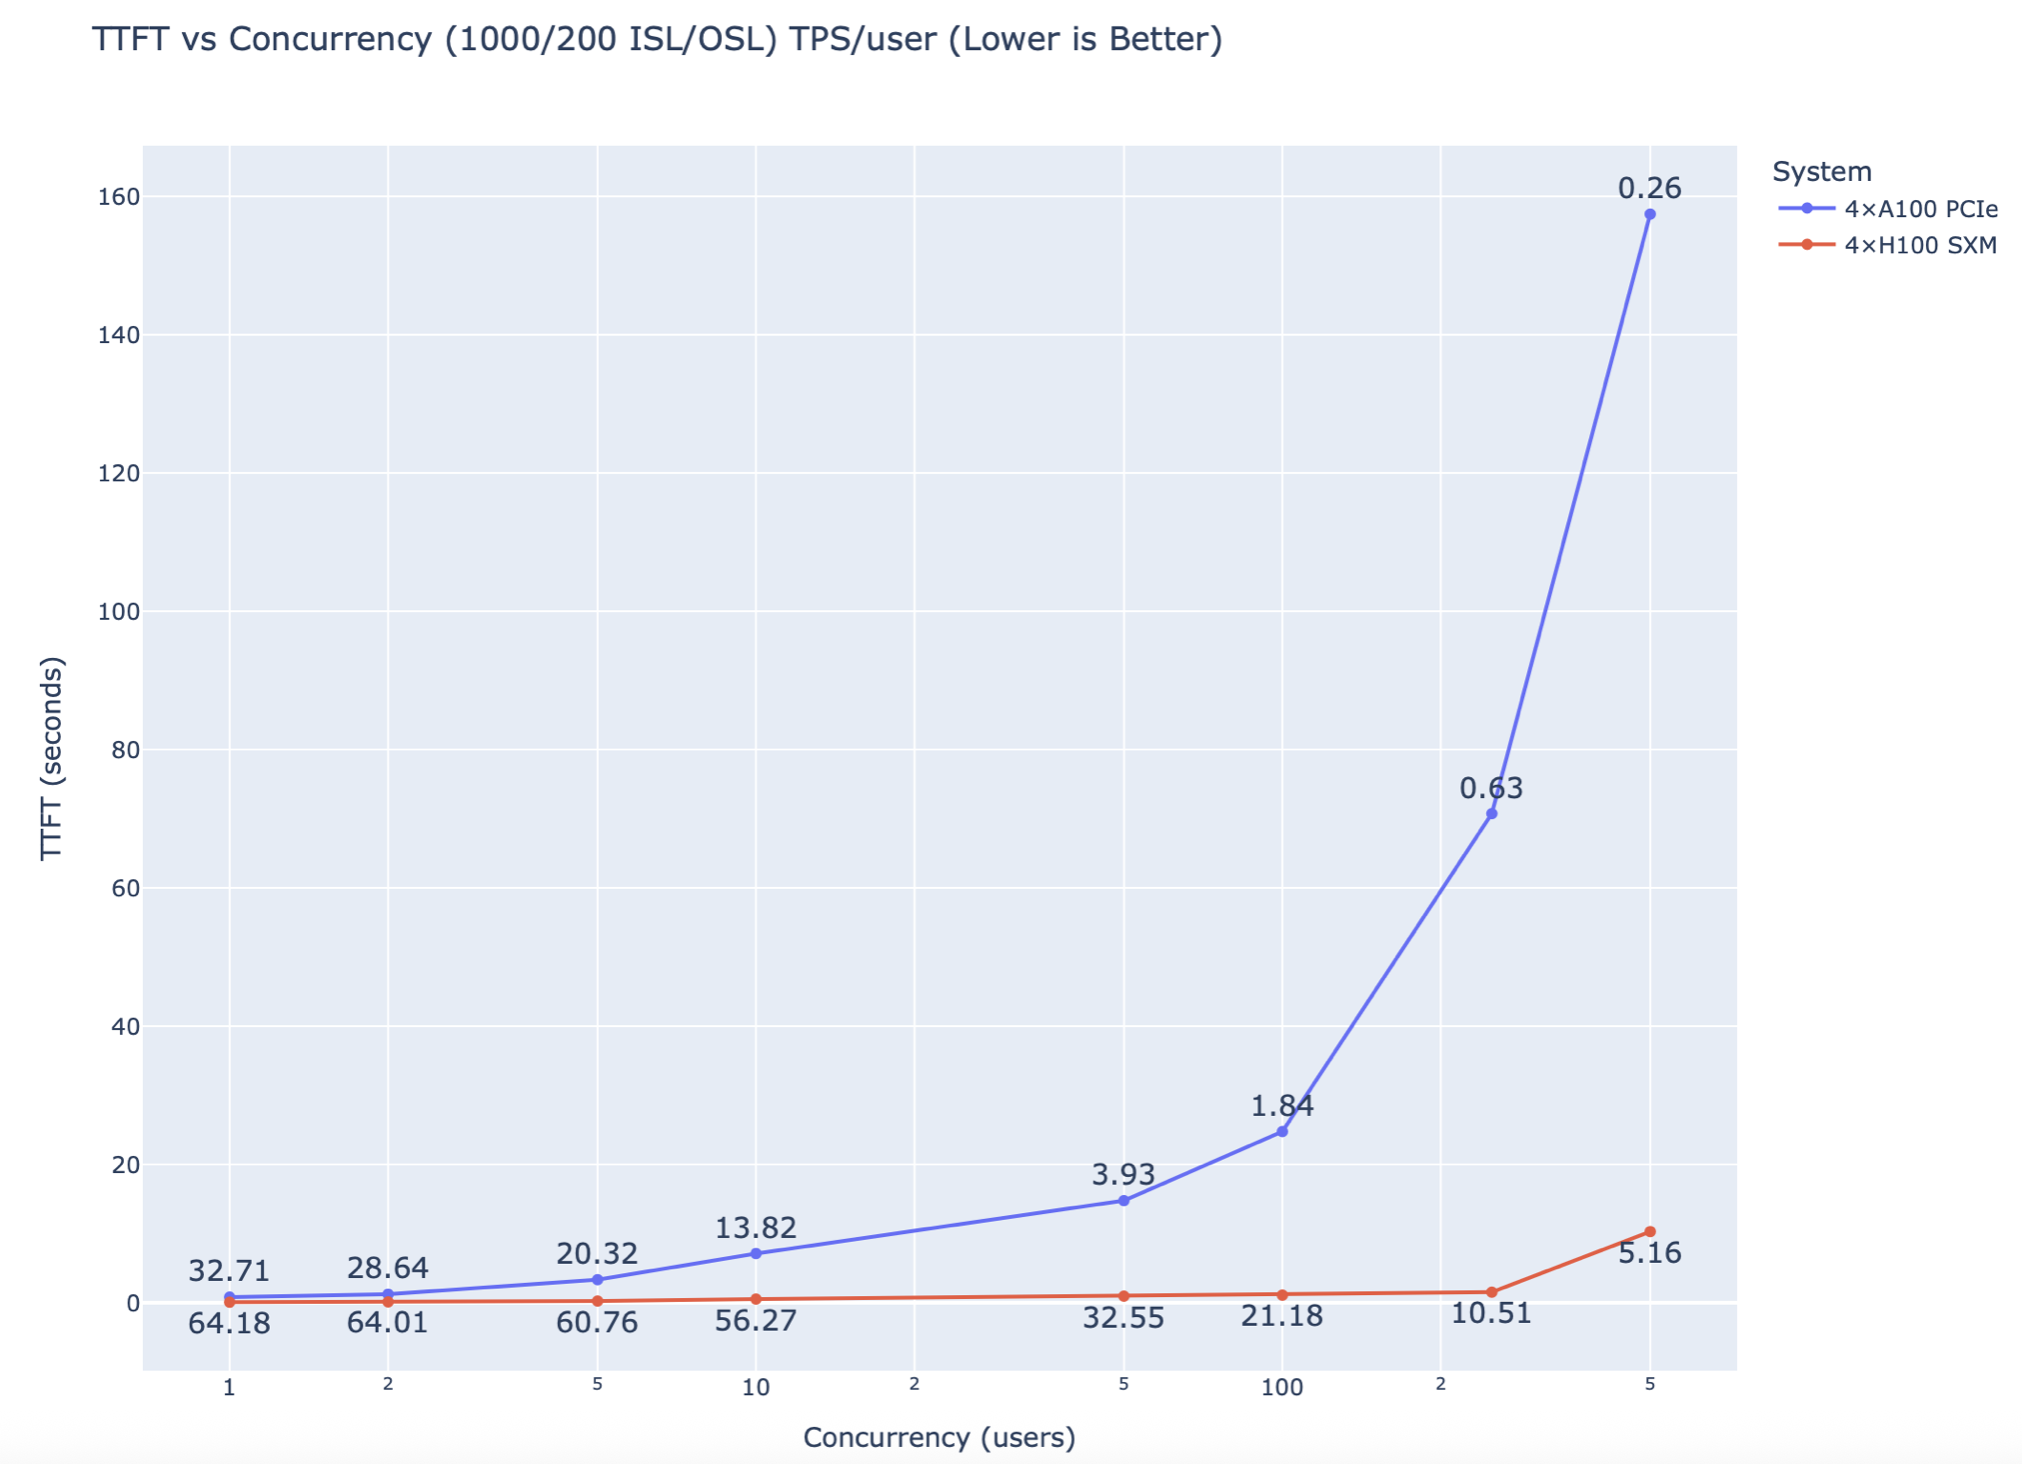
- H100 maintains <5s TTFT latency out to the full user sweep - indiciating, additional capacity beyond 500 users.
- A100 TTFT quickly spikes 10-20 concurrent users above 5s TTFT latency.
Discussion
- Hopper has numerous enhancements over Ampere aside from just faster clock-speeds, additional SMs, and memory bandwidth with HBM3 vs HBM2e. Those enhancements include Tensor Memory Accelerators (TMAs), FP8, and Transformer Engine. All of these lead to significantly increased throughput and lower latencies at higher user counts.
- In most cases, H100s will be acheive target latency and concurrent user count requirements at a lower price than A100s. Taking the current cost of an on-demand AWS
p4de.24xlargeinstance with 8xA100s compared to thep5.48xlarge, the cost increase the two is 2.4x, but the throughput increase can be as high as 14x, which justifies the premium. Likewise, it would take 13 instancesp4de.24xlargeinstances to match the throughput of thep5.48xlargeinstances. - Longer input & output sequence lengths will increase latency and decrease concurrency/throughput.
- Blackwell will offer a similar and more pronounced multiple increase in throughput compared to Hopper. Hopefully, I will be in a position to do Blackwell testing soon as hardware becomes more available.
- Although the
llama-3.3-70bmodel will fit on 2x80GB A100s or H100s at bfloat16 precision, it leaves very little room for a KV Cache, so the supported minimum per the NVIDIA NIM documentation is 4x80GB A100s or H100s.
Key Takeaways
- Hopper’s advantage is multiplicative, not incremental. In interactive‑LLM scenarios the H100 system provided an order‑of‑magnitude gain in both throughput and p50 latency.
- Latency SLOs drive hardware choice. If your service promises sub‑second first‑token latency under real‑world concurrency, A100 will need disproportionate over‑provisioning or sharding; H100 meets the target comfortably.
- Identify Input/Outut Sequence Length (ISL/OSL) based on workload. Input/output sequence lengths vary widely based on task, such as summarization. Reasoning models also change the dynamic with possibly far more output tokens for what might be a relatively short input sequence.
- bf16 is the sensible default. It balances memory footprint with performance on both architectures and is the path of least resistance inside NIM. At this time
fp8orint4profiles are not available from thellama-3.3-70b-instructmodel with NVIDIA NIM. - Measure under expected concurrency. Single‑request benchmarks tell an incomplete story; backlog effects dominate once users count climbs. 5 seconds is my personal rule of thumb for TTFT.
Reproducing the Experiment
The benchmarks can be reproduced by running using the start_nim.sh & benchmark.sh scripts provided in the above GitHub repository. The “NVIDIA NIM LLMs Benchmarking” documentation on genai-perf is also an excellent resource with some great insights into the various benchmarking metrics, as well as some of NVIDIA’s own benchmarking data with various ISL/OSLs and NIM profiles.
Silex Data Solutions
Whether you’re evaluating hardware architectures for your AI/ML workloads, optimizing infrastructure costs, or planning scalable deployment strategies, Silex Data Solutions combines deep technical expertise with practical experience to help you make informed decisions that align performance requirements with business objectives. Learn more about Silex Data Solutions by visting our website.